How to get rayshaded
😎
Nathan ‘Nate’ Day
2019-03-06
1 / 12
5 Steps to Shade
- Find a elevation map
- Read that map into R
- Convert it to raster
- Convert it to matrix
- 😎
3 / 12
1) Find an elevation map
The US government has got you (at least on this)
Download the elevation as IMG format
img_file <- "~/Downloads/USGS_NED_13_n38w080_IMG/USGS_NED_13_n38w080_IMG.img"4 / 12
2) Read that map into R
Be careful, they're big fellas
library(rgdal)GDALinfo(img_file)## rows 10812 ## columns 10812 ## bands 1 ## lower left origin.x -80.00056 ## lower left origin.y 36.99944 ## res.x 9.259259e-05 ## res.y 9.259259e-05 ## ysign -1 ## oblique.x 0 ## oblique.y 0 ## driver HFA ## projection +proj=longlat +ellps=GRS80 +towgs84=0,0,0,-0,-0,-0,0 +no_defs ## file ~/Downloads/USGS_NED_13_n38w080_IMG/USGS_NED_13_n38w080_IMG.img ## apparent band summary:## GDType hasNoDataValue NoDataValue blockSize1 blockSize2## 1 Float32 TRUE -3.402823e+38 64 64## apparent band statistics:## Bmin Bmax Bmean Bsd## 1 118.096 1293.38 394.8112 190.6556## Metadata:## BandDefinitionKeyword=NONE ## ConfigKeyword= ## DataType=Elevation5 / 12
2b) Read a small chunk of that map into R
Use offset and region.dim to subset
gdal <- readGDAL(img_file, region.dim = c(1000,1000) )6 / 12
3) Convert to raster
library(raster)rastr <- raster(gdal)7 / 12
4) Convert to matrix
dat <- extract(rastr, extent(rastr), buffer = 1000 )mat <- matrix(dat, nrow(rastr), ncol(rastr) )8 / 12
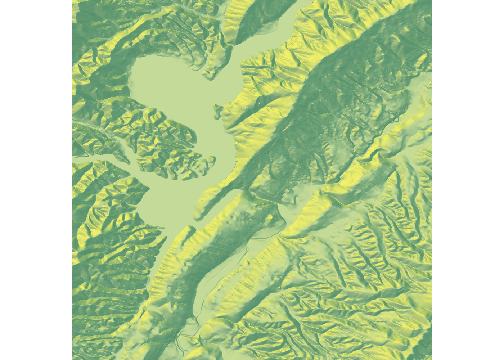
5) 😎
library(magrittr)library(rayshader)mat %>% sphere_shade() %>% plot_map()
9 / 12
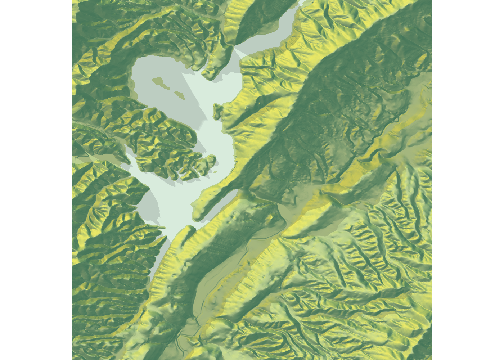
5b) 😎 🌊 🌓�🌓
mat %>% sphere_shade() %>% add_water(detect_water(mat)) %>% add_shadow(ray_shade(mat)) %>% plot_map()
10 / 12
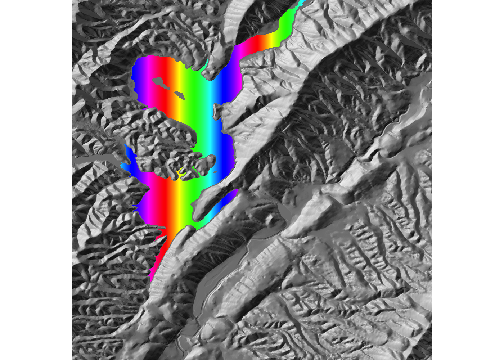
5c) 😎 🦄
mat %>% sphere_shade(texture = "bw") %>% add_water(detect_water(mat), color = "unicorn") %>% plot_map()
11 / 12
Learn more
Watch the best talk from rstudio::conf 2019
3D mapping, plotting, and printing with rayshader - Tyler Morgan-Wall
12 / 12
